LeanBI boosts digitization in rolling stock maintenance in rail traffic

In a joint project between LeanBI AG and Prose AG at Zentralbahn AG, we are investigating how artificial intelligence AI and machine learning can reduce rolling stock investment and maintenance costs and compensate for the loss of knowledge by retiring operation and maintenance experts.


Failure statistics from recent years show three conspicuous systems that are responsible for well over half of the total downtime of rolling stock: doors, train security and traction converters.


The project investigates rolling stock that supplies cloud-based sensor data to an artificial intelligence system during operation, which continuously analyzes this flood of data and generates cause-and-effect synapses through machine learning in a self-learning manner.

Fig.1: Basic architecture of a knowledge-based system based on ontology and AI


The reduction of rolling stock downtime is achieved by transforming static maintenance processes into dynamic operations.


The ontology is used in machine learning to align the language structuring and later processing of the data. It describes the relationship between the individual knowledge stocks and thus creates the prerequisite for machine learning to be applied. For the use case of rail vehicle maintenance, the essential component of ontology development is the cause-effect modeling between the error descriptions and categorization and their elimination or reporting. Only in this way can they be processed by machine and logical conclusions and optimizations derived from them.


The scalability of the achieved results and situation-based maintenance are the main focus of this project. The transformation of the maintenance organization into a knowledge-based, agile process structure will then be worked out.


Based on a joint proof of concept at Zentralbahn AG, the present article has been developed, which shows the exciting development possibilities of Artificial Intelligence and Machine Learning.


Here the link directly to the magazine ETR (subscription required):

https://eurailpress-archiv.de/SingleView.aspx?show=1941606


Here is the link to the ad in LinkedIn, where the article can be read directly.

LinkedIn


Please read this really exciting article that shows the fundamental paradigm shift.


Despite Corona, the world-famous Cybathlon will take place again this year, in the new virtual format. LeanBI is sponsoring the successful team of the OST (University of Applied Sciences Eastern Switzerland) as it does every year.


The Cybathlon 2020 will take place virtually this year, on November 13 and 14. Therefore, this event is no less exciting, especially for those who are involved in robotics and artificial intelligence. Here AI directly helps humans, the Cybathlon has been helping to advance the technology for years.


Pilot Florian Hauser from HSR enhanced is back in the race and fighting for medals. With our work on artificial intelligence, we are close to these topics. That’s why we are committed to it. LeanBI is proud to make a small contribution to this important sport as a bronze sponsor.


We are very happy that the Cybathlon will live on in 2020 despite Corona in this innovative virtual coat. Be part via the Internet and experience the emotions of the pilots and teams and the fascination of technology!


Here all information about the event and the registration link (free of charge):


https://cybathlon.ethz.ch/de/event

The new LeanBI website is ONLINE


LeanBI has developed strongly in the last 3 years. Our focus is primarily on the combination of Data Science/Artificial Intelligence (AI) and Industry 4.0/IoT. At the same time, we also remain to the classic topic of Business Intelligence (BI), as SMEs continue to look for simple solutions to help them make better decisions.


On our new website we not only show our unique know-how in these 3 areas, but also some of the solutions we have developed over the years.


Our website is now more dynamic and functional. We keep a clear structure, but have reduced the text as far as it makes sense for us. Have fun browsing.

Zentralbahn AG LeanBI and PROSE shapes digital future

Decision support system for data-driven maintenance of rolling stock

Decision support system for data-driven maintenance of rolling stock

A recent McKinsey survey on most European railway operators states that fifty per cent of their knowledge-workforce will retire within the next ten years. To stay operational, executives must think on how to operate their future organization and integrate a pro-active knowledge-management within its processes.

In practice, machine learning and artificial intelligence can manage big data from sensors that deliver a health-state-image from the rolling stock (i.e. locomotive, wagon) and learn from the experienced maintenance decisions of the knowledge-workers day by day, thus making “core”-knowledge available and reproducible. With every experienced decision, artificial intelligence and machine learning improve their knowledge base and can start to make suggestions and assist in failure detection and problem solving.

LeanBI and Prose, the Swiss specialist for Mobility Engineering, jointly develop a decision support system for data-driven maintenance of rolling stock. A first implementation will be operationalized for the Swiss operator “zb Zentralbahn AG”. Gerhard Züger, COO of “Zentralbahn”, emphasizes the financial impact of this strategic digitalization initiative: “Digitalization will help us reduce maintenance costs and thus increase our competitiveness in the near future.”

The Canton Berne Economic Development Agency supports this digital initiative with its financing Covid-19 program based on industrial location promotion guidelines for research & development projects.

In the past, maintenance organizations that have been optimized on planned activities and have triggered their asset (locomotives and/or wagons) to get maintained on a timely or distance basis understood the world from a descriptive point of view. Within a MIT (Massachusetts Institute of Technology) program “Digital Business Strategy: Harnessing our digital future”, PROSE designed a digitalized asset management world, where the asset (i.e. the locomotive) itself informs the maintenance organization.

In a prescriptive paradigm, maintenance activities base on a predicted system status, and give an availability forecast through the analysis of pattern and trends. Only agile organizations and processes can manage this paradigm change, supported by digitalized maintenance system that generates solution proposals and decision support.

The financial side of the business model increases by maximizing availability of the asset due to a digitalized and ongoing health-state-image of the asset that not only triggers maintenance base on the actual condition of the asset but predicts the maintenance need in the future. If the availability of the individual asset is higher, less asset in total is necessary to fulfill a transportation need. Thus, asset investments are reduced for operators.

For LeanBI and PROSE we see digitalization as a strategic move for the Swiss operator market. Due to a significant income drop in times of Covid-19 in the market segment operator, cost efficient maintenance becomes the key topic.

Deep Learning for damage detection in tunnels

Last year, LeanBI successfully implemented a Deep Learning project for the engineering company Amberg AG, in which the efficiency of tunnel maintenance was increased by 60%. The AI component developed by LeanBI and based on image segmentation using deep learning has meanwhile been integrated into the maintenance software of Amberg.


Deep Learning für die Schadenserkennung in Tunnels


The manual evaluation of images or laser scans from tunnels is extremely time-consuming and is often performed by engineers. Luckily, a big part of the process can be automated using deep learning for object detection and segmentation. A deep network detects damages such as cracks or wet areas, but also other objects of interest like pipes or electrical boxes in the tunnel. The network is not only able to detect objects, but also identify the exact pixels associated to them on the image. This is of tremendous help to the engineers, as they originally had to draw by hand polygons around damaged areas, or lines annotating cracks. Now they only need to follow the software’s proposal, and confirm the automatically detected damages, or edit the automatic annotation before confirming.


One of the challenges that most deep-learning projects face, is the need for a large amount of training images, that must be labelled manually. By choosing the right family of deep networks and customizing it to be able to learn with less data, we were able to obtain very good accuracy with only a few hundreds of meters of annotated images. Another factor that played a crucial role to our success was the efficient use of the labelled data. When the labelling process is expensive (costly or time consuming), we can use what is called data augmentation, to artificially increase the amount of labelled data we can use for training and achieve much better accuracy.


A further benefit of our solution is that it automatically quantifies uncertainty. This means, that when it identifies an object, it also gives a probability of how “surely” this object is in the identified class. Is the object wet with a 99% certainty, or only with 60%? This information is important to prioritize and save time in the final tunnel evaluation.


Alzbeta Prokopova, Application and Support Engineer at Amberg AG was interviewed by Tunnelling Journal about this project. You can find the whole interview in the Feb/Mar 2020 issue  on page 11.


LeanBI has helped Amberg to implement part of the solution in the cloud, which has massively reduced the analytical costs. This is not only a technical challenge, but also an economic one, as large government institutions and large engineering companies must be convinced of the security and reliability of data storage in the cloud.


Amberg has also solved the problem that no Internet connection can be established in the tunnels. They therefore developed an offline version of the software that can be synchronized with the Internet as soon as network connection is available.


Automating damage detection with Deep Learning not only increases productivity, but also improves the quality and consistency of the detection. By automatizing the process, it is also easier to track temporal changes in tunnels, by running the same deep network on images of the same tunnel captured in different periods.


With the maintenance solution from Amberg Engineering and with the support of LeanBI, tunnel inspections can therefore be carried out as required and not at a fixed rigid schedule as was previously the case.

Modelling of causes and effects

Prescriptive Analytics is a further step in applied data analysis. It is also an important basis for improving the results of predictive analytics.

In the field of Business Intelligence, the “Analytics maturity model” from Gartner is generally known. We illustrate this in a somewhat extended form in Figure 1.

The maturity model of data analytics according to LeanBI based on the Analytics maturity model according to Gartner

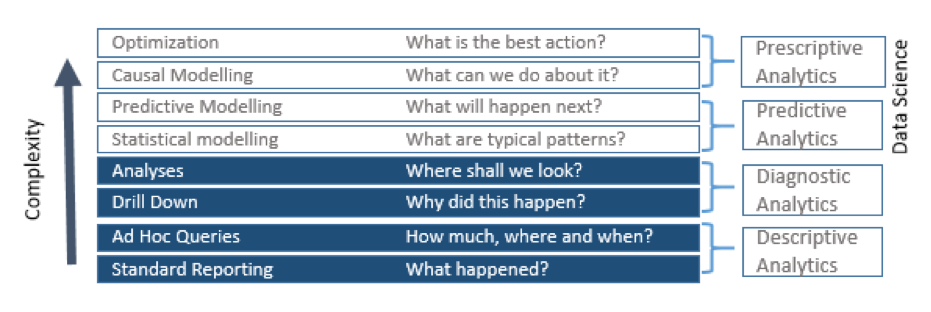
Figure 1: The maturity model of data analytics according to LeanBI based on the Analytics maturity model according to Gartner

Along the stages, the complexity of data analysis increases from bottom to top. The original area of Business Intelligence covers reporting and data analysis (in LeanBI with OLAP,Online Analytical Processing, using multidimensional cubes). The upper area of Data Science can be divided into predictive and prescriptive analytics. Most of today’s data science use cases deal with predictive analytics and leave prescriptive analytics out. Thus, most of today’s models such as Deep Learning can be used to detect patterns in order to predict, for example, the damage of a machine component, as LeanBI does with LeanPredict. With predictive analytics, however, it is less easy to draw conclusions about the causes of the damage, the more difficult it is the wider the models are. Therefore, in this blog we want to deal with the topic of prescriptive analytics, especially the modelling of causes.

Quantifying the effect of a factor

Trying to find the cause that can lead to a change in a product we want to optimize can be tackled by different techniques depending on context. In marketing, for example, we want to answer questions like “does the position of the button change the click rate of the user?”. In this context, we have the freedom to change the parameters (the position of the button) and use A/B testing to measure the actual effect of the change between users clicking the button in the old position and users clicking the button in the new position.

On the other side, in predictive maintenance, we want to answer questions like “does the change of the rotation speed that I observed last month lead to earlier breaking of the machine?”. In this case, if we assume that the change of speed happened without our intervention (like an anomaly) and we do not control it directly, we can only measure its effect based on observations. We must analyze the machines that broke or not, and which of them had an unexpected change in the rotation speed or not. In this type of problems, where we do not have control over the parameters in question, and we can thus not set up experiments, but only observe results a posteriori, we need to use the mathematical models of the field of causal inference.

Causal inference and causality versus correlation

There are different approaches in the field of causal inference. One of the most important representatives in the field is Judea Pearl, who has been honoured with many awards, including the well-known Turing Award in 2011. He is the pioneer of Bayesian networks, causal models about which we want to write today.

Predictive analytics has its pitfalls when we fail to take influencing factors into account sufficiently in our models. We bring a medical example from Judea Pearl, because it is very clear to all of us: If we apply the influence of sporting activities to the cholesterol level, we get a dependence according to Figure 2.

Abhängigkeit der Cholesterin-Spiegels von sportlichen Aktivitäten nach

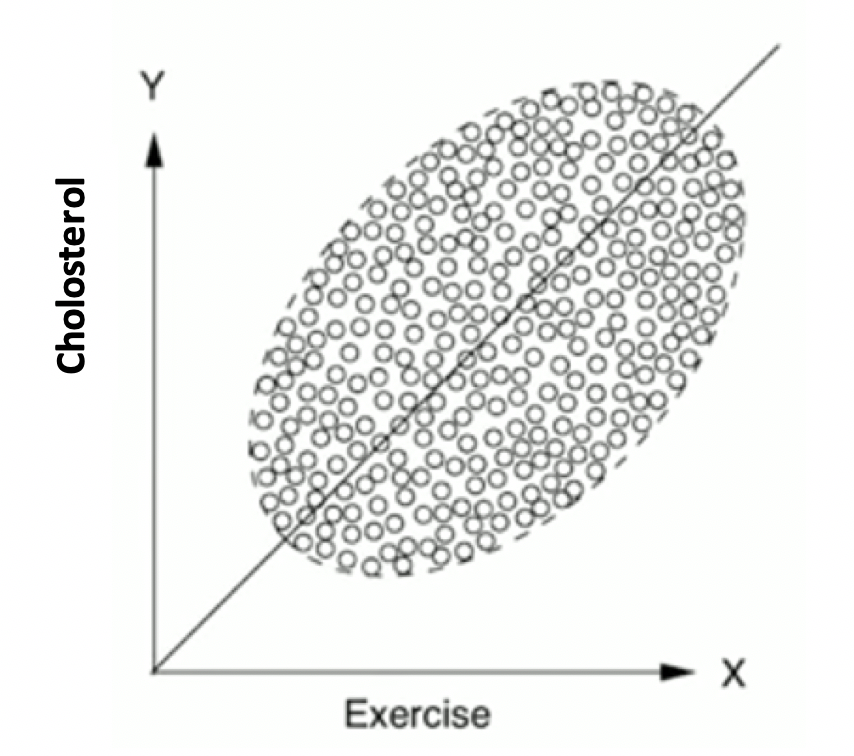
Figure 2: Dependence of cholesterol levels on sporting activities according to [1].

We interpret that more sport leads to higher cholesterol levels because we see a high correlation between the two variables. Actually, we don’t expect that. So what’s wrong? – We’ve overlooked an important factor, which is age. If we take this parameter into account additionally, we suddenly interpret the same amount of points quite differently, by grouping people by age before analyzing each group separately. As expected, there is now a negative correlation between cholesterol and amount of sports for each group. Why was this not obvious before? Because for this data, older people not only have higher cholesterol, but also fight against it by doing more exercise. Age causes both parameters to increase, so they seem highly correlated if we do not take age into account. When we “control for age”, however, we understand that it is the cause of higher exercise and of higher cholesterol at the same time. But most importantly, exercise is also a cause for lower chelosterol (see Figure 3).

Einbezug des Alterseinflusses auf den Cholesterinspiegel nach [1]

Figure 3: Inclusion of the influence of age on the cholesterol level according to [1].

Wrong interpretations like the one of Figure 2 can happen in Data Science, because wrong parameters are included in the models or because the importance and relationship between the parameters are misidentified. This can then have more or less serious consequences. At the very least, such misinterpretations from inadequate models are accompanied by a loss of confidence in the data science capabilities.

Therefore, we see that research into the causes and relationships of different effects is important in order to have more meaningful modelling. With causal research, the correlations of analytical models become causalities.

Causal inference in the industry

How do we do this in our field of industrial data analysis? In industrial data analysis, we detect an approaching damage due to a deviation of the measured data from normality (like an anomaly). We call these measurement data “effects”. Let’s take temperature as an example. If a temperature increases at the location of a surface, it may be possible to predict an approaching damage. But how certain can we be?

Let us look at the following generic graph:

Causes - Effect – Graphical model of a machine damage

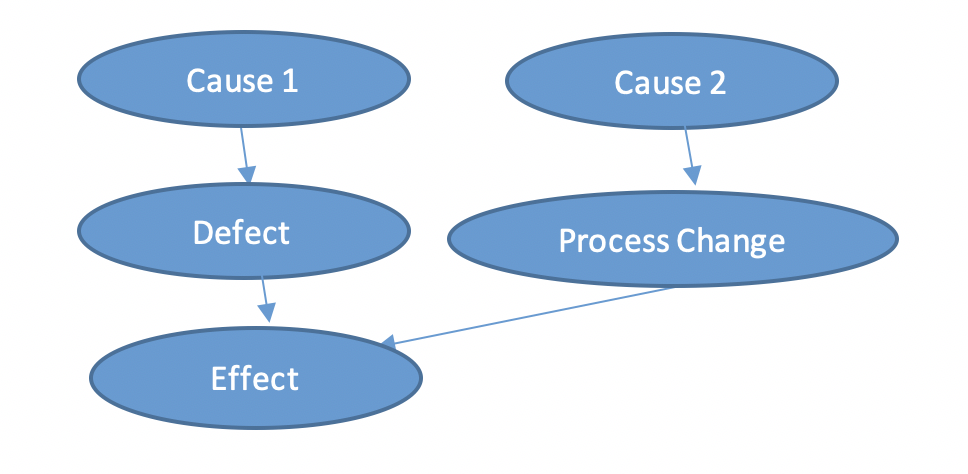
Figure 4: Causes – Effect – Graphical model of a machine damage

A measured (“observed”) effect can have several reasons and each reason has one or more causes. However, if we have not paid enough attention to the causes and interrelationships of the effects, there is a risk that we will produce false alarms. This is because an increase in temperature can have several reasons, for example a process change or damage to a component. So we have to find out the causalities, which requires specialists in the relevant fields. For LeanBI, this means holding workshops with the specialists on site, be the engineers or production operators.

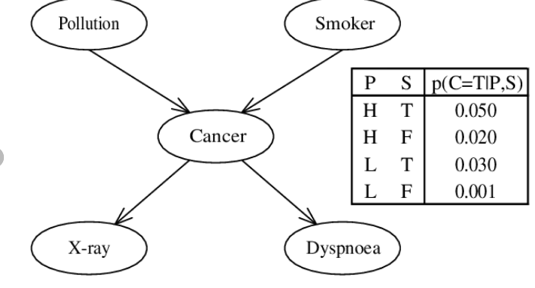
So when we have a better understanding of the cause-effect chains, we can define probabilities of which effects will occur under which conditions. What is the procedure? We form causal networks, so-called graphical models. An important representative of causal models is the “Bayesian Network”. Figure 5 again shows a plausible example from medicine. We form probabilities for each effect and write them in tables.

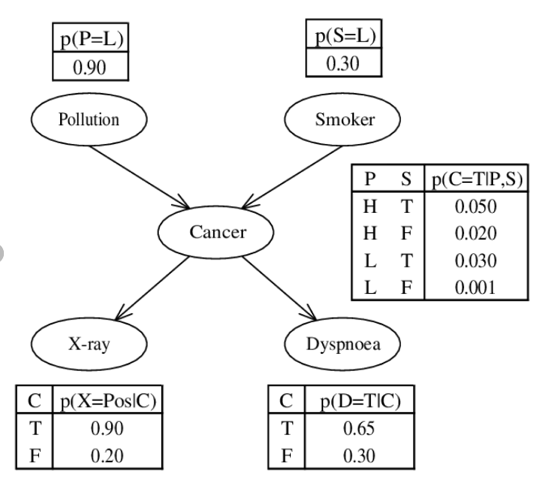
Figure 5: Example of a simple “Bayesian Network” graph: Connection of lung cancer according to [2]

Take the table in the middle, for example: If we have P (Pollution) = H (High) and S (Smoker) = T (True), the probability of getting cancer is 0.05, as a non-smoker S (Smoker) = F (False) in the same environment is only 0.02. The results of different effects/measurement methods such as X-Ray or dyspnoea (respiratory difficulty) indicate with certain probabilities that cancer is present. It is therefore necessary to determine the probabilities with studies, experiments or with the help of the field experts.

It can be very complex to evaluate correct cause-effect mechanisms, and the interpretation is difficult. For example, events do not have to occur simultaneously and can even change over time. Therefore, a central point is to ask the right questions about the network (Judea Pearl calls this “Do Operator”). Questions here are also counter-questions: What would have changed if event B had never occured? These are called “counterfactuals”. “What if it’s not cancer, as shown by the x-ray?” With such questions we enrich the network and improve it.

The exciting thing is that the graphical models can be transferred 1:1 into mathematical models. An important term for this is conditional probability. We determine the probability of an event A under the condition that event B applies. This is written as P(A I B) or PB (A). In the Bayesian network this is how the nodes are described. And with this the mathematical model of the whole graph can be built.

The Bayesian Network models mathematically represent a cause-and-effect reality that we have recognized. It is a reality reduced to influences and areas of interest to us, and always associated with uncertainties. Within such networks we can explore reality by applying and varying the mathematical models. In this way, we expand our knowledge space in terms of modelling. This is a great advantage, because we can hardly experiment with people to better understand the causes of cancer (like marketing experts do with A/B testing). Exactly the same in an industrial environment. The data situation is limited and test data is expensive or not available at all. The models help us to better understand the machines and their damage out of their observed behaviour.

Were expert systems not already solving the problem?

Given that we use input from field experts to create causal models, it makes sense to compare them to old style expert systems. But there is a fundamental difference between the two approaches. In expert systems, the know-how of the field experts was hard coded in the “inference engine”, in the form of logical rules, not as probability distributions. The experts were coding clearly understood failure mechanisms, that of course is very restrictive and not possible for many use cases. At that point, there was no machine learning involved, so this type of systems did not go that far.

In causal inference, on the other hand, the experts give a range of possible mechanisms that could lead to a failure, to create one or more causal graphs. Then it is up to the data to explain / quantify which of the cases is more plausible, while the experts can in a next iteration refine the models based on that. Once the models are fixed, we can use them to perform not only diagnostic analytics, but also predictive and prescriptive.

Looking into the future

Finding the cause of a failure (“why did it happen”) per se falls mostly in the category of diagnostic analytics. However, once we have a causal model fit to our data, we can use it as a soft form of the process’s digital twin. The model is a powerful tool that we can use for predictive, but also prescriptive analytics.

Modern machine learning, with deep learning as its flagship have tackled many problems that were unimaginable 10 years ago. However, today’s new need is more and more to have interpretable, or explainable models, and deep learning by itself is not enough. Probabilistic machine learning and modelling can fill this gap, se we already see a new trend of deep learning combined with probabilistic modelling being shaped. It is not a coincidence that the most used deep learning library today, Tensorflow, added very recently a “probability” module incorporating very important inference tools. The possibilities are endless.

Prescriptive Analytics is a further step in applied data analysis. It is also an important basis for improving the results of predictive analytics. LeanBI, looking into the future, is investing in this direction. In the future, LeanBI will increasingly combine both stages directly with each other. Thus, the result of a Bayesian Network can be the input for Deep Learning. A node of a Bayesian Network can be a Deep Learning model. Or the prediction of a Deep Learning Model flows into a Bayesian Network to better identify the cause of a problem.

Literature:

[1] Keynote: Judea Pearl – The New Science of Cause and Effect, PyData LA 2018: https://www.youtube.com/watch?v=ZaPV1OSEpHw&t=3299s

[2]: Particle swarm and bayesian networks applied to attribute selection for protein functional classification, 2007

Flashback of 11 LeanBI Presentations at outstanding Conferences Year 2019

The past year, after many successful projects at LeanBI, applying Artificial Intelligence in industrial environments, we shared our knowledge at various conferences and events. Here is a short conference Flashback of the past year 2019.

We launched our LeanPredict product at the Industry 4.0 R&D Conference in January 2019. LeanPredict is a modular end-to-end Predictive Maintenance (PdM) framework, which features a range of sensors that is unique in the Predictive Maintenance environment. With LeanPredict as a basis we can now implement more efficiently many Predictive Maintenance Use Cases. LeanPredict can be used especially for the retrofit of various production plants.

Our many years of experience in Predictive Maintenance projects is consolidated in our unique approach of solving such problems. We were invited to talk about our conceptual approach for the first time at the Smart Maintenance Conference in February 2019 in Zurich.

At the Industry Forum 2025 in May 2019, we had the pleasure of presenting our successful Predictive Maintenance solution at the Swiss Post distribution centre together with Post CH AG. We were happy to get very positive feedback after the presentation.

Our next conference was in May 2019 in New Orleans, USA. The International Conference of Learning Representations (ICLR, pronounced [eye-clear]) is the largest deep learning conference in the world, with over 4000 participants this year. We were there to present our work on Large Scale Graph Learning, and to speak about the latest trends of Deep Learning, one of our favourite models in our recent projects.

At the Swiss Conference on Data Science SDS 2019 in June 2019, we reported on our success story on Deep Learning Image Recognition for automating maintenance work in tunnels. With this project for Amberg Engineering AG we have massively expanded our experience in object recognition from image. In this case images were taken from the interior of tunnels, but similar solutions can be developed for many other applications of Image Recognition.

One after the other it went on: The digital retrofit of Condition Monitoring on existing plants has arrived in the industry. We demonstrated this with many examples of different plant types at the FMPRO Maintenance Manager Roundtable in June 2019. The digital retrofit can be implemented in some cases without great project effort, but often we are still far from pure plug & play, and project work is still needed until such solutions go live. With LeanPredict, however, we can reduce such efforts considerably.

At the 13th International Mechatronic Forum in September 2019, the focus was on “Smart Data”, i.e. how to not only generate information from data but also support decisions. Here too, LeanBI is making a major contribution with its BI and data science solutions.

Then a future-oriented topic at the Smart Service Summit in Zurich: How to build future central Smart Services platforms in the field of Predictive Maintenance? There is a need for action to make AI more intelligent by automatically incorporating the know-how of maintenance experts into the models. This is a continuous “Active Learning” process. Automated decision bases are accepted when risks become transparent for decision making. This was the theme of our “Challenges of Plug & Play Predictive Maintenance” at the Smart Service Summit on September 13, 2019, where we presented our conceptual considerations on new, AI-based expert systems to research and industry experts.

LeanBI is an active member of «Expert Group Smart Data» of the Industry 2025, which aims to provide specific successfully implemented use cases for SMEs in order to lower the entry threshold for SMEs. For this purpose we have set up the website www.smartdata2025.ch, which is constantly being expanded. Our group demonstrated its field of action with a poster at the partner event Industry 2025 in October 2019.

Then the Finance and Economy Forum in October 2019 in Rüschlikon: “We were very proud to be invited to this industry forum for the upper Management: The presentations on the limits of AI and IoT in the smart factory on the topic of Digital Transformation, Industry 4.0 were intended to put the hype surrounding AI into perspective. IoT and AI still have many limitations that need to be considered. “Success means knowing your limits and embracing them”.

Finally, in November 2019, the Swiss Alliance for Data-Intensive Services, Smart Maintenance Expert Group, provided industry specialists with insights into our data science solutions. This was also a very successful event with lots of positive feedback.

For us Summa Summarum is a year of successful projects and personal networking! It was very nice to meet many new and exciting people. We learned a lot at the conferences ourselves. And we’re already moving on, this time to the Smart Maintenance Conference 2020, on 12 February at Messe Zürich.

We are looking forward to an exciting 2020!