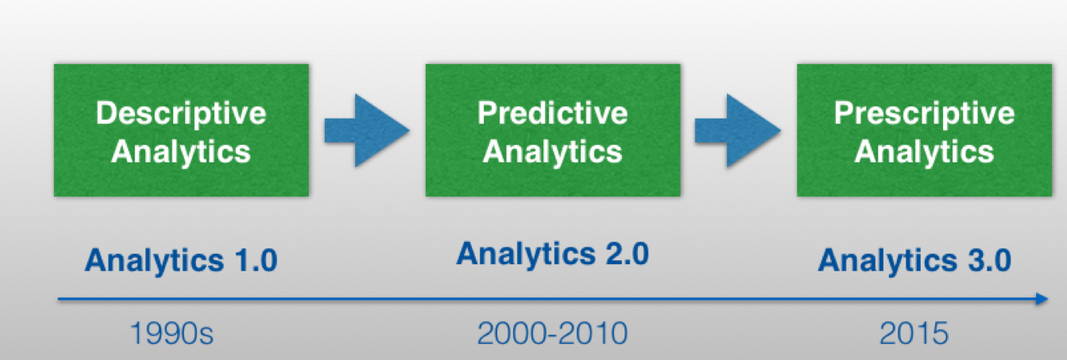
In Predictive Analytics historical and current data are statistically analyzed in order to make predictions of trends or behaviors (often in the future) using the gained insights. The predictions are statistical in nature and look something like: There is 90% probability that beer consumption will rise by 21% in Rio in early August 2016 and in Bern by 25%. Predictive Analytics is already finding applications today:
- Predictive Maintenance: The timing of a product defect can be predicted –> The company managing the maintenance can react in advance
- Customer satisfaction: A company can predict the satisfaction level of a customer in advance -> The customer is then proactively assisted with his problems –> It is done with the hope that customer will remain loyal
- Credit Scoring: The Bank can estimate the likelihood of a borrower repaying a loan in time –> Decision is taken whether to extend the credit
- Predictive Police: Burglaries can be predicted in Zurich –> Target oriented deployment of Police can take place
A successful Predictive Analytics project consists of the following three key elements and we will focus on their technical implementation in this blog.
- Access to relevant data
- A question that is required to be answered with the data
- And a technical implementation of algorithms and models
Overview of the procedure
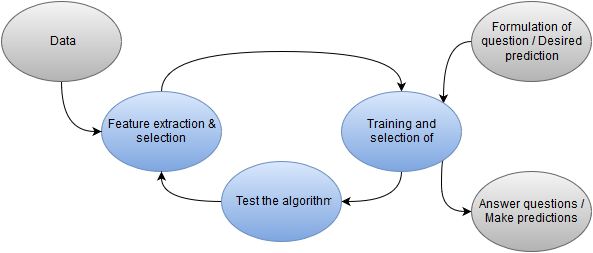
Image: Process for Predictive Analytics.
The Data is cycled through the process of Feature Extraction and Feature Selection. Here, it is essentially decided how certain information should be processed before it is used (Feature Extraction) and out of the existing data, which information should actually be used (Feature Selection). The resulting selected features then pass through an algorithm which is trained by using available results obtained in the past. As shown in the image, a progressive optimization takes place where better and relevant features are added and those features that do not help the algorithms are deleted. Further, different algorithms are tested until a satisfactory prediction is obtained. The best-trained algorithm will then be used for providing high quality predictions with new data. We will now discuss these various points in greater detail.
Feature Extraction
A date, for example, can provide many kinds of information: weekday, weekend, school holidays, August 1st is just around the corner and the Olympics are about to start. Depending on the question, all this information can be very usefule: weekend -> More time for drinking, August 1 -> Large retail sales the day before Olympics -> Spike in beer demand, etc. Thus, Feature Extraction can be a decisive factor in ascertaining whether an algorithm can correctly predict the demand for beer.
Feature Selection
The selection of the data features (Feature Selection) also plays a significant role in the process. A sea of all kinds of data may be available and known but it is not wise to apply the algorithm to all the available data as it can lead to the problem known as Overfitting. The information that the Bern Onion Market took place on 23 November 2015 can have enormous influence on the consumption of Glühwein (mulled wine) but it is not relevant for predicting the consumption of beer and it is rather likely to cause noise. Further, the algorithm now must also learn to ignore this information. It may happen that certain irrelevant data features may acquire higher weights in the algorithms leading to sub-optimal predictions.
A question of dataset
The task of Feature Extraction and Feature Selection can be completely handled by the computer. If the quantum of data is large enough and sufficient computing capacity is available no human intervention may be needed. An algorithm should have no problems in finding out that the last Summer Olympic Games in London boosted the consumption of beer and that this was not a one-off occurrence (the previous Olympics also led to an increased consumption of beer). Thus, a computer can find the feature “Olympic Games” independently and it would not require any human interaction. It would of course only work if the data covering the period of the last few Olympic Games (15-20 years) is also available. This requires an adequate data base (mostly Big Data) and large computing power (up to data centers such as Google). With large amounts of data and high computing power, overfitting tends to lose its impact. If either the large computing power or the required amount of data is not available, then humans would be required to process at least a part of the features (although possibly not on the 1st of August). A tool for using the right features is data visualization. The visualizations bring new insights and an understanding of the data and they can also provide clues as to whether a relationship between a feature and the required prediction exists. In particular, one can plot a possible feature against the desired prediction. (For example, beer consumption versus beer production.) It can then be discovered that that the beer production in the 7-day cycle drifts away from beer consumption since not much beer is produced on weekends when the consumption is highest. Thus, a good data scientist will suggest choosing the weekend as a feature. The guiding principle for medium-sized projects is a combination of human and automated Feature Extraction and Feature Selection. If the human identifies both the relevant and irrelevant, noisy features, it makes the work that much easier for the computers. The algorithms can now detect the remaining features themselves. By moderating the quantity of automated processing required for Feature Selection, the computation complexity and the risk of Overfitting is reduced.
Choosing and training machine learning algorithms
The data and the selected features will now be handed over to the algorithm for training purposes. From experience, the algorithm is now able to learn, among other things, by how much the last Summer Olympics increased beer consumption. The computer can therefore also estimate the impact of games on the beer consumption and predict higher beer consumption on 10 August 2016, when the Olympic Games in Rio would be underway. Of course, this learning does not happen individually on any one single feature (the Olympics) but is a result of training on all the selected features (Olympics, Weekend, 1 August, FIFA World Cup, Oktoberfest, Weather, Season, Gurten Festival, etc.). However, the question that arises next is, which machine learning algorithm should be used? We would like to suggest a few important requirements for the algorithms:
- Required accuracy: Sometimes, a very accurate prediction is not required. In this case, relatively imprecise algorithms can be used which are processed much faster.
- Available data volumes: When the amount of data is small, only one algorithm with a few parameters can be used. More complex, more accurate and computationally intensive algorithms with more parameters are possible with larger amounts of data.
- Explanatory algorithms: It may happen that in addition to a prediction, one may also wish to have an explanation of how the prediction was obtained. The algorithm should, for example, communicate that the prediction for beer consumption is very high as the Olympic Games in Rio would be underway at this time. Many machine learning algorithms are not able to accomplish this.
- Private algorithms: In the programs/libraries which are often used, not all algorithms are available. The effort required to program an algorithm or to use a new library can be high. Due to this reason, there is certainly some incentive to make use of existing algorithms.
Practically, there is no one algorithm that can fulfill all wishes. Particularly so, because the “perfect” algorithm is not implemented in the tools used. It is therefore reasonable to start with a simple algorithm which is available at the touch of a button and will quickly perform the calculations. When such an algorithm does not deliver a reasonable prediction, it is unlikely that a more sophisticated algorithm would arrive at a good prediction. At that point, it is more productive, for example, to use additional data and improved features. However, if the prediction quality of a simple algorithm needs to be improved a little, more sophisticated algorithms can be quite helpful and thus a step by step search can be made for better algorithms and features.
Testing machine learning algorithms
Data is required not only for training an algorithm, but it is also required for testing (or in other words, for measuring the quality of an algorithm). Therefore, the existing data will be divided into two groups. With one of these groups, known as the training data, the algorithm is trained and with the other group, i.e. the test data, the algorithm is tested. In such a test, the algorithm is queried to deliver a certain prediction. The delivered prediction is then compared with the real measurements in the test data. If the predictions match closely with actual measurements, the algorithm is considered to have performed well. I would like to say a few words about the division of the data into training and test data. The division should be as realistic as possible so that one is not misled by the test. For example, a realistic test would take place if we were to test against the data of last month for automatic beer demand. The algorithm is then trained with all data which was already available a month ago. Subsequently, the trained algorithm provides the desired prediction for the future (from this month). When testing, the prediction will now be compared against the measured values of this month.
Answer questions / make predictions
With the features selected and algorithm trained, the machine can now make the desired predictions. Thus, for example, it will be known how much beer to produce. The logistics can also be optimized, as we now know where and how much the demand for beer would be. Fortunately, the prediction is made automatically, leaving sufficient time for you to enjoy the Olympics with your cool, favorite beer in your hand.
Questions
Write to us with any questions or if you are interested in a live demonstration (info@leanbi.ch) or call us at (+41 79 247 99 59).